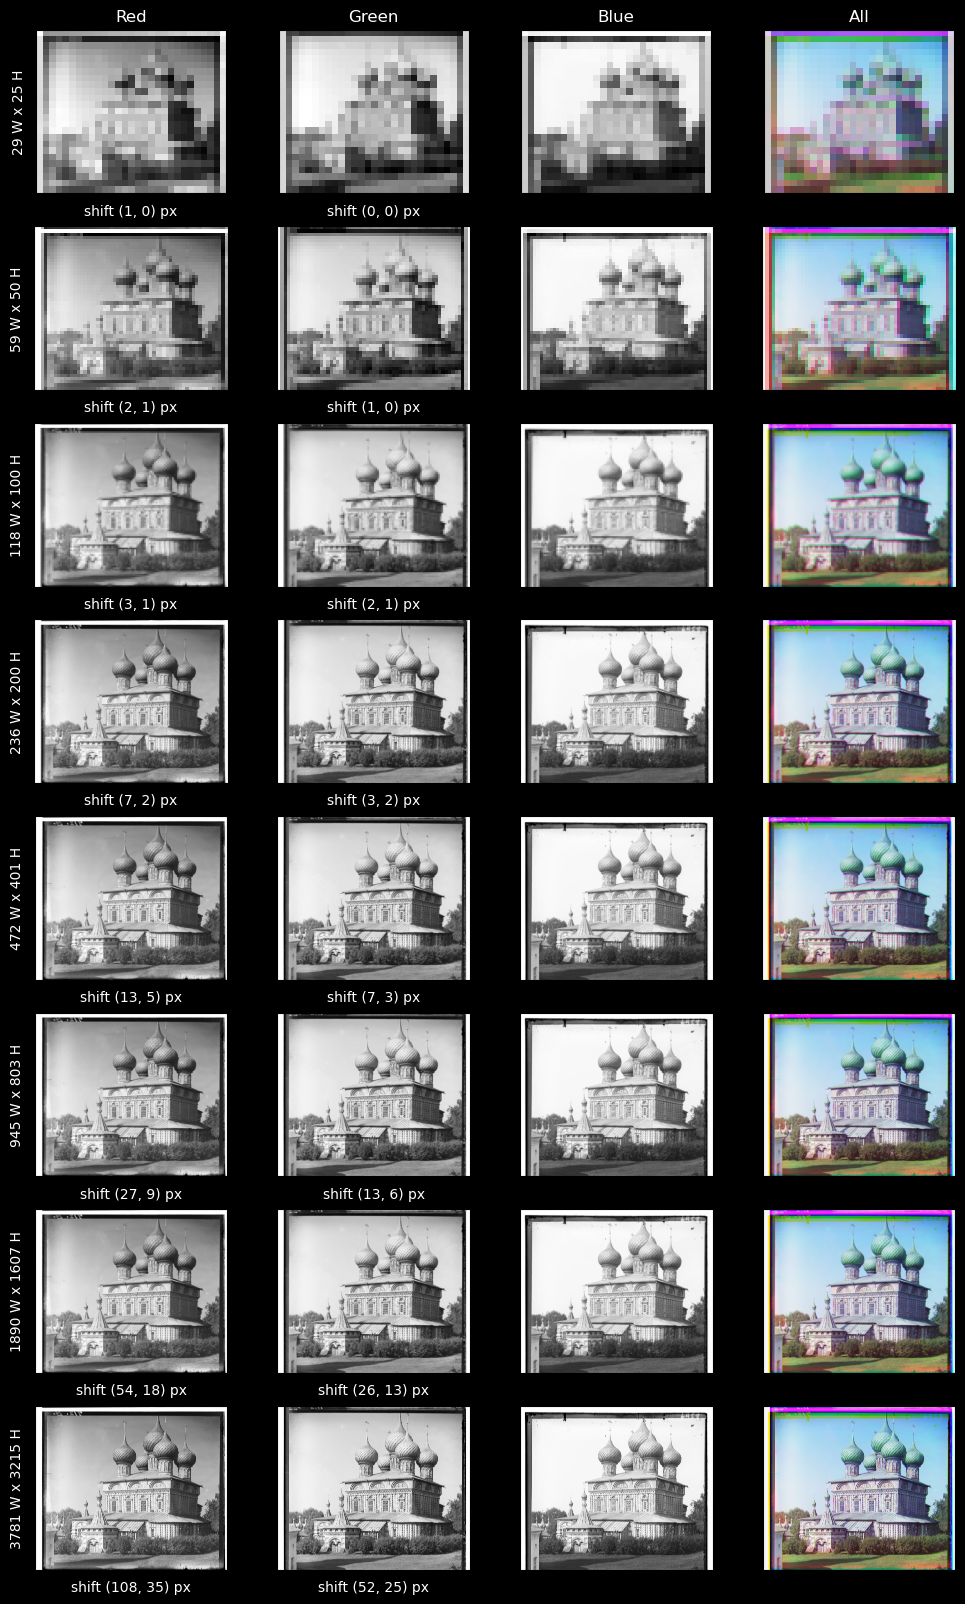
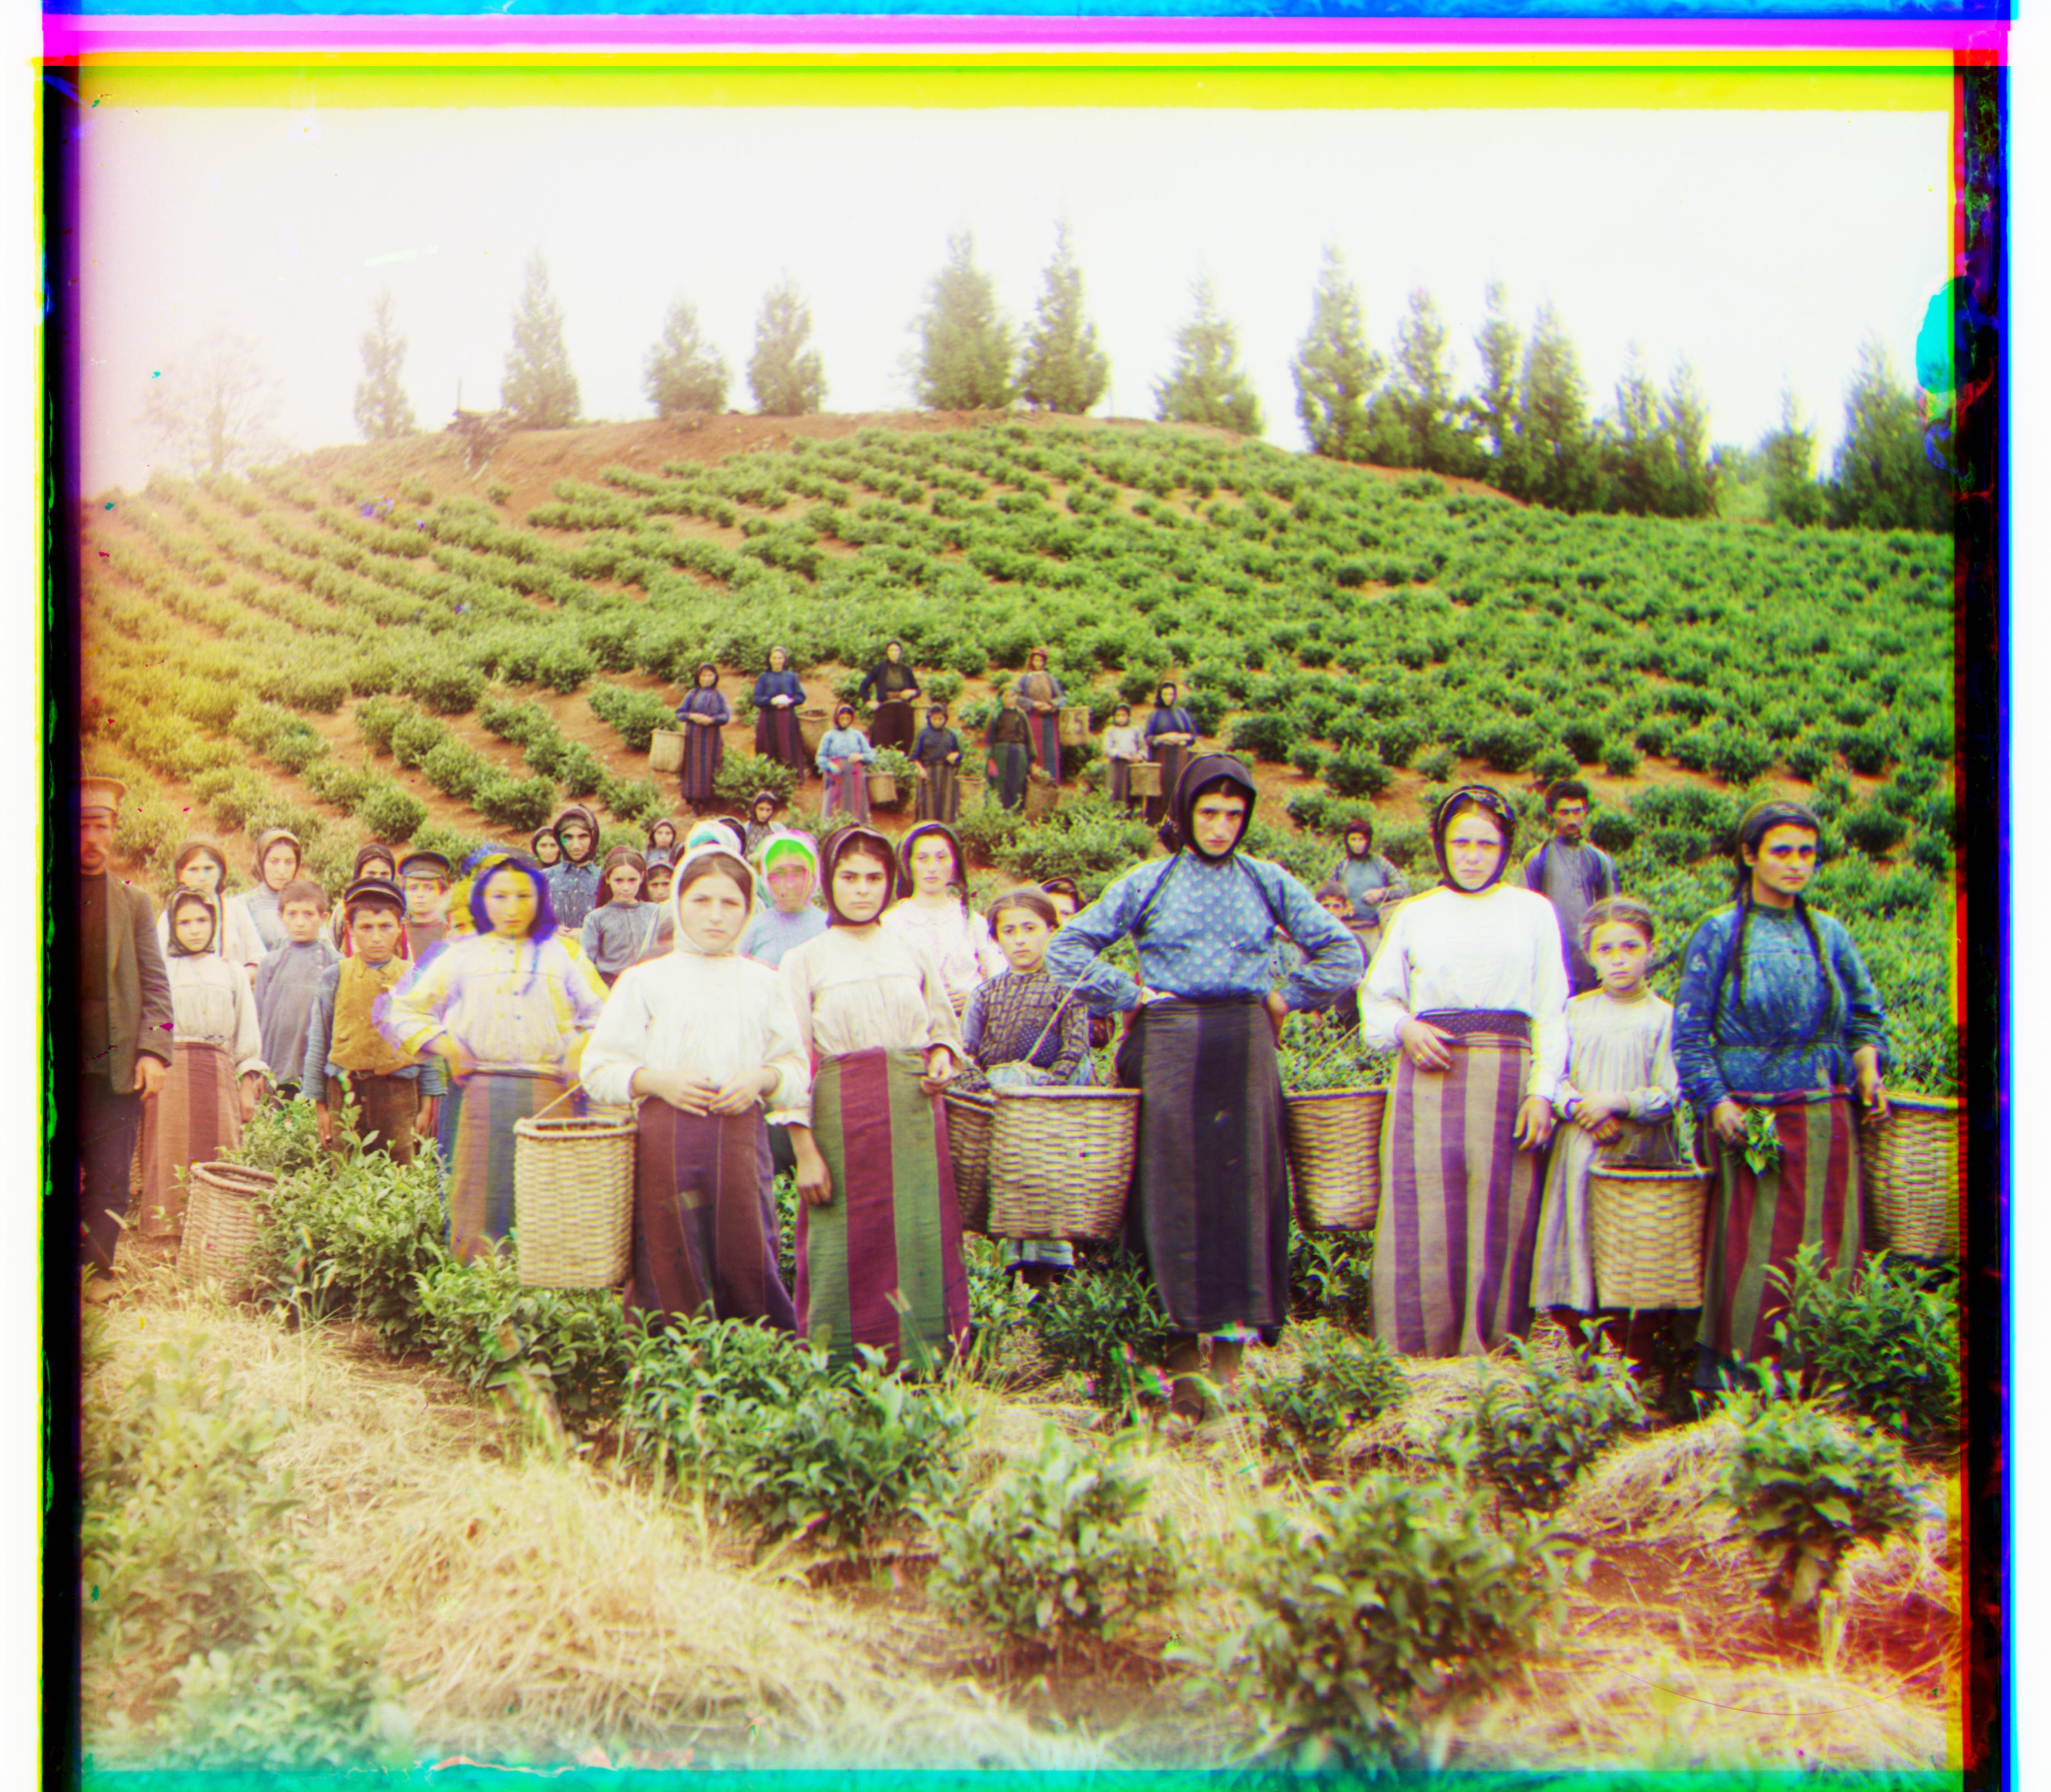
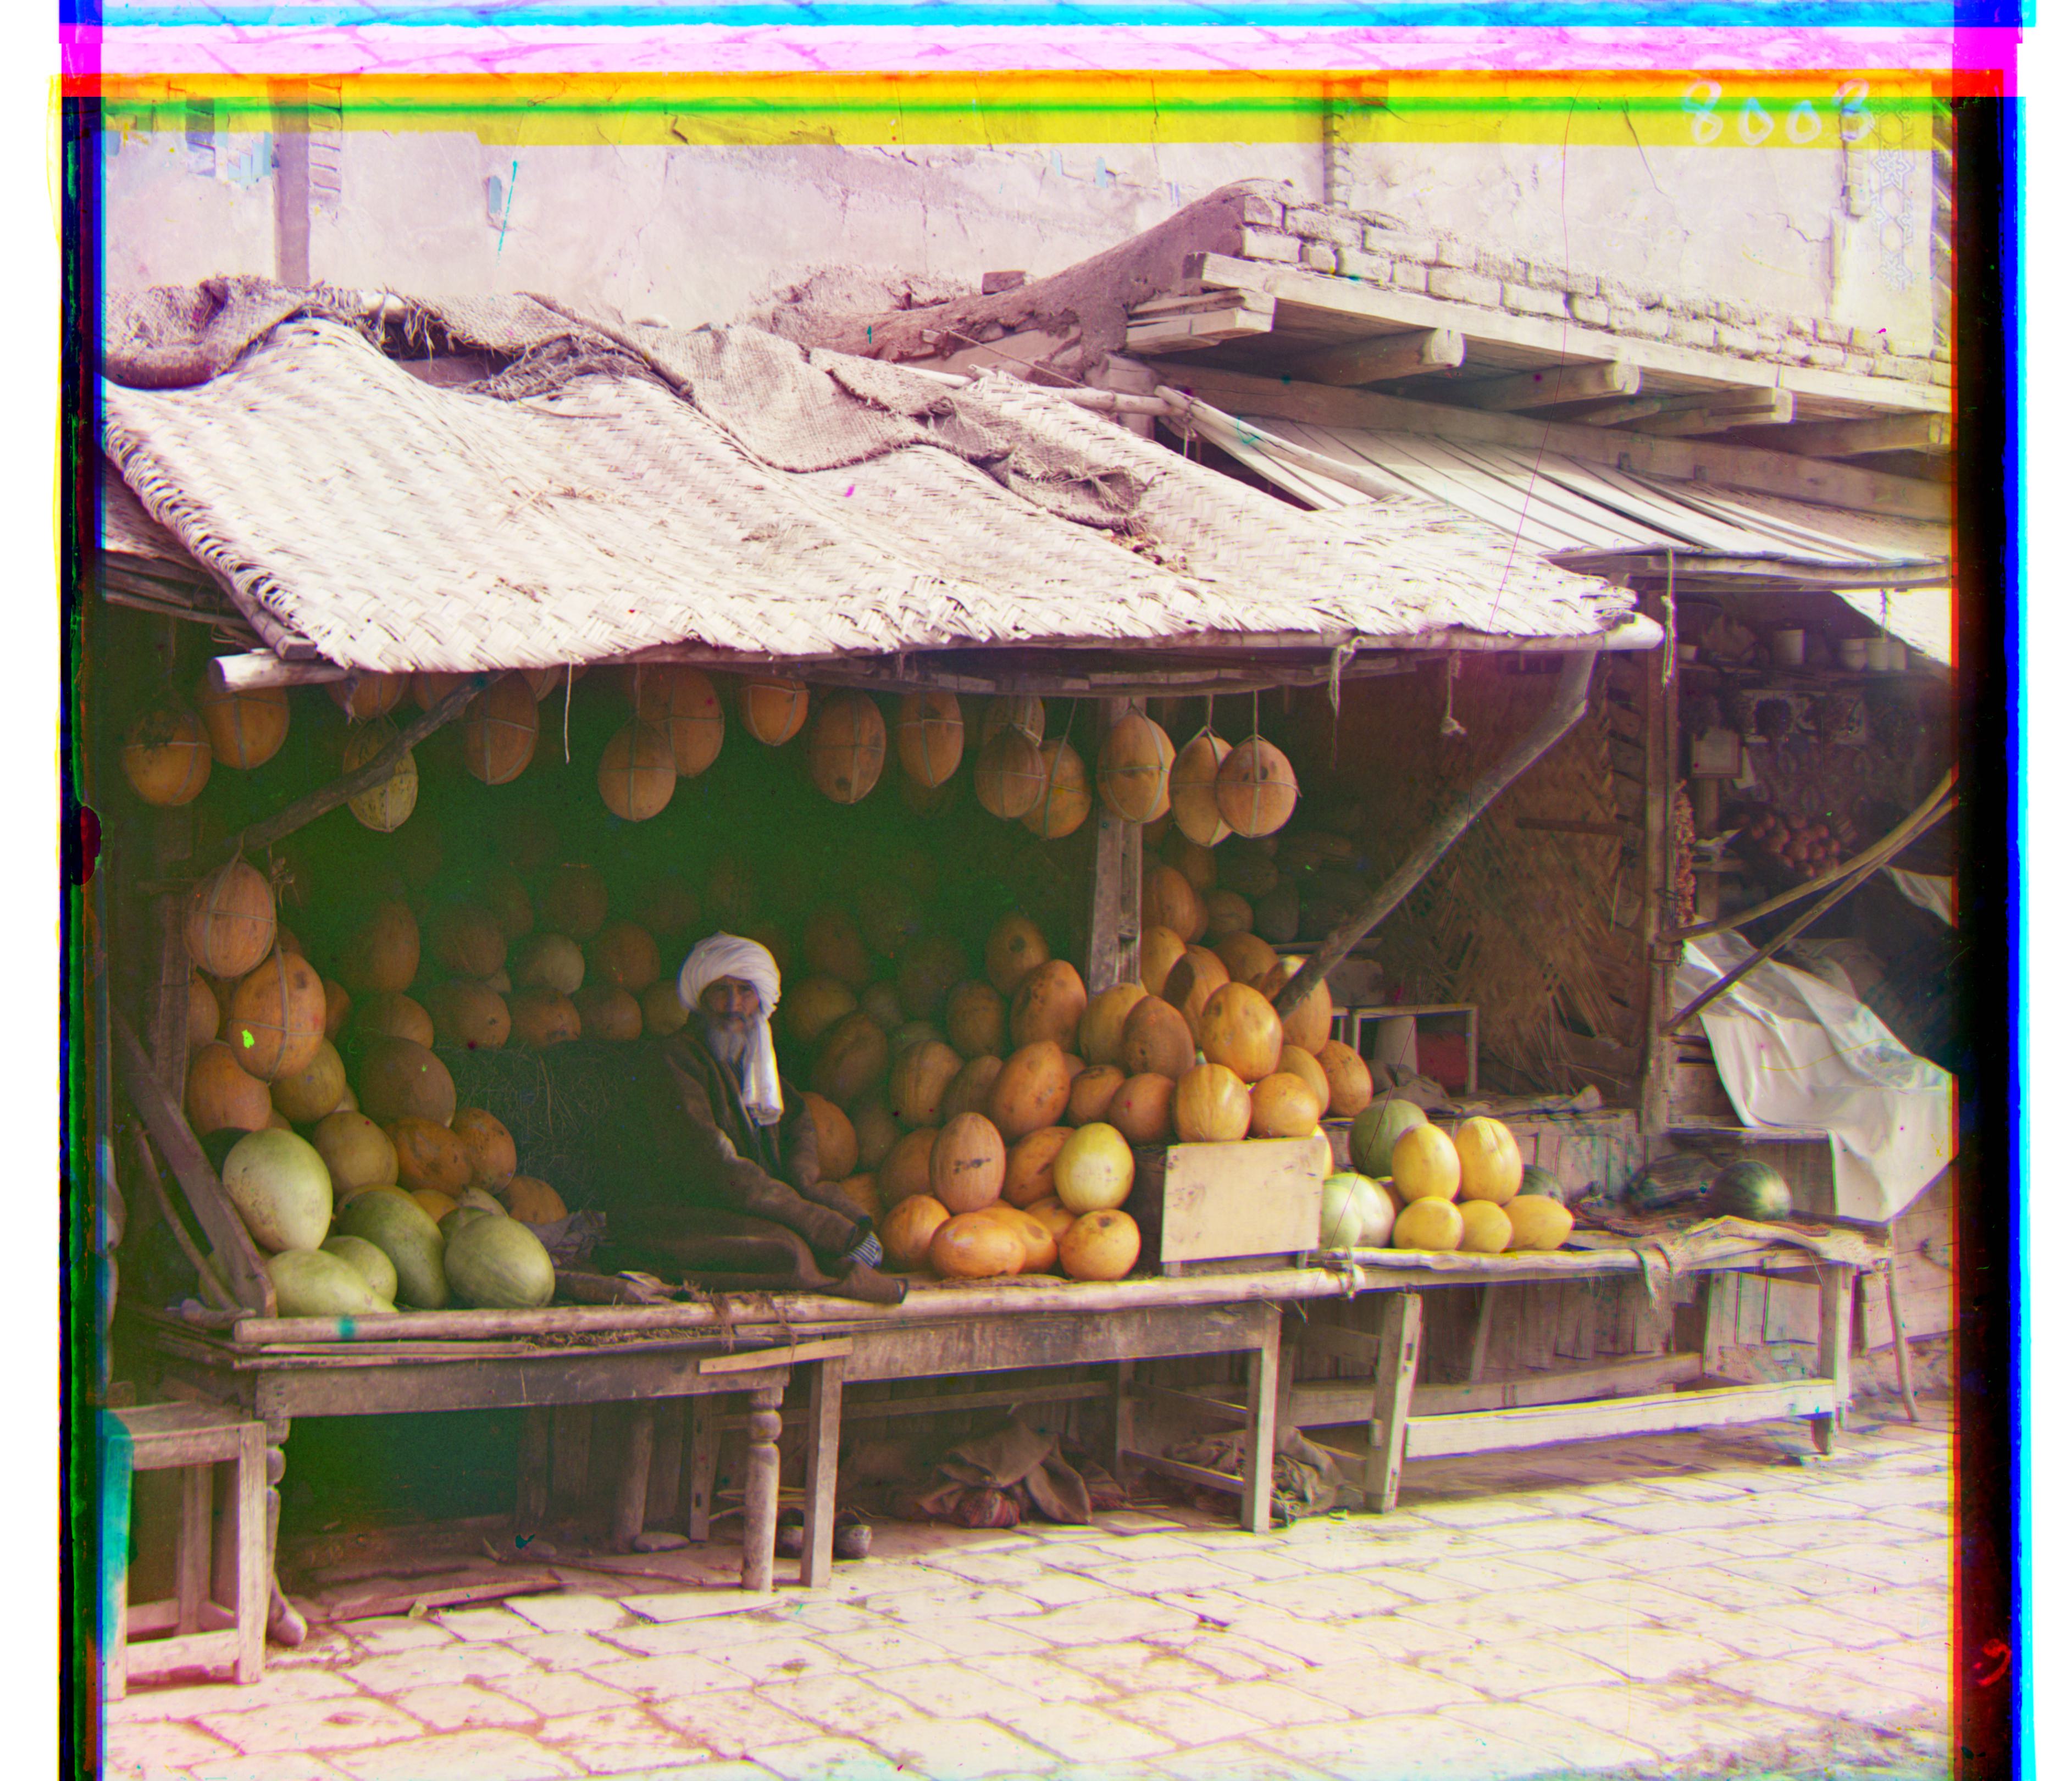
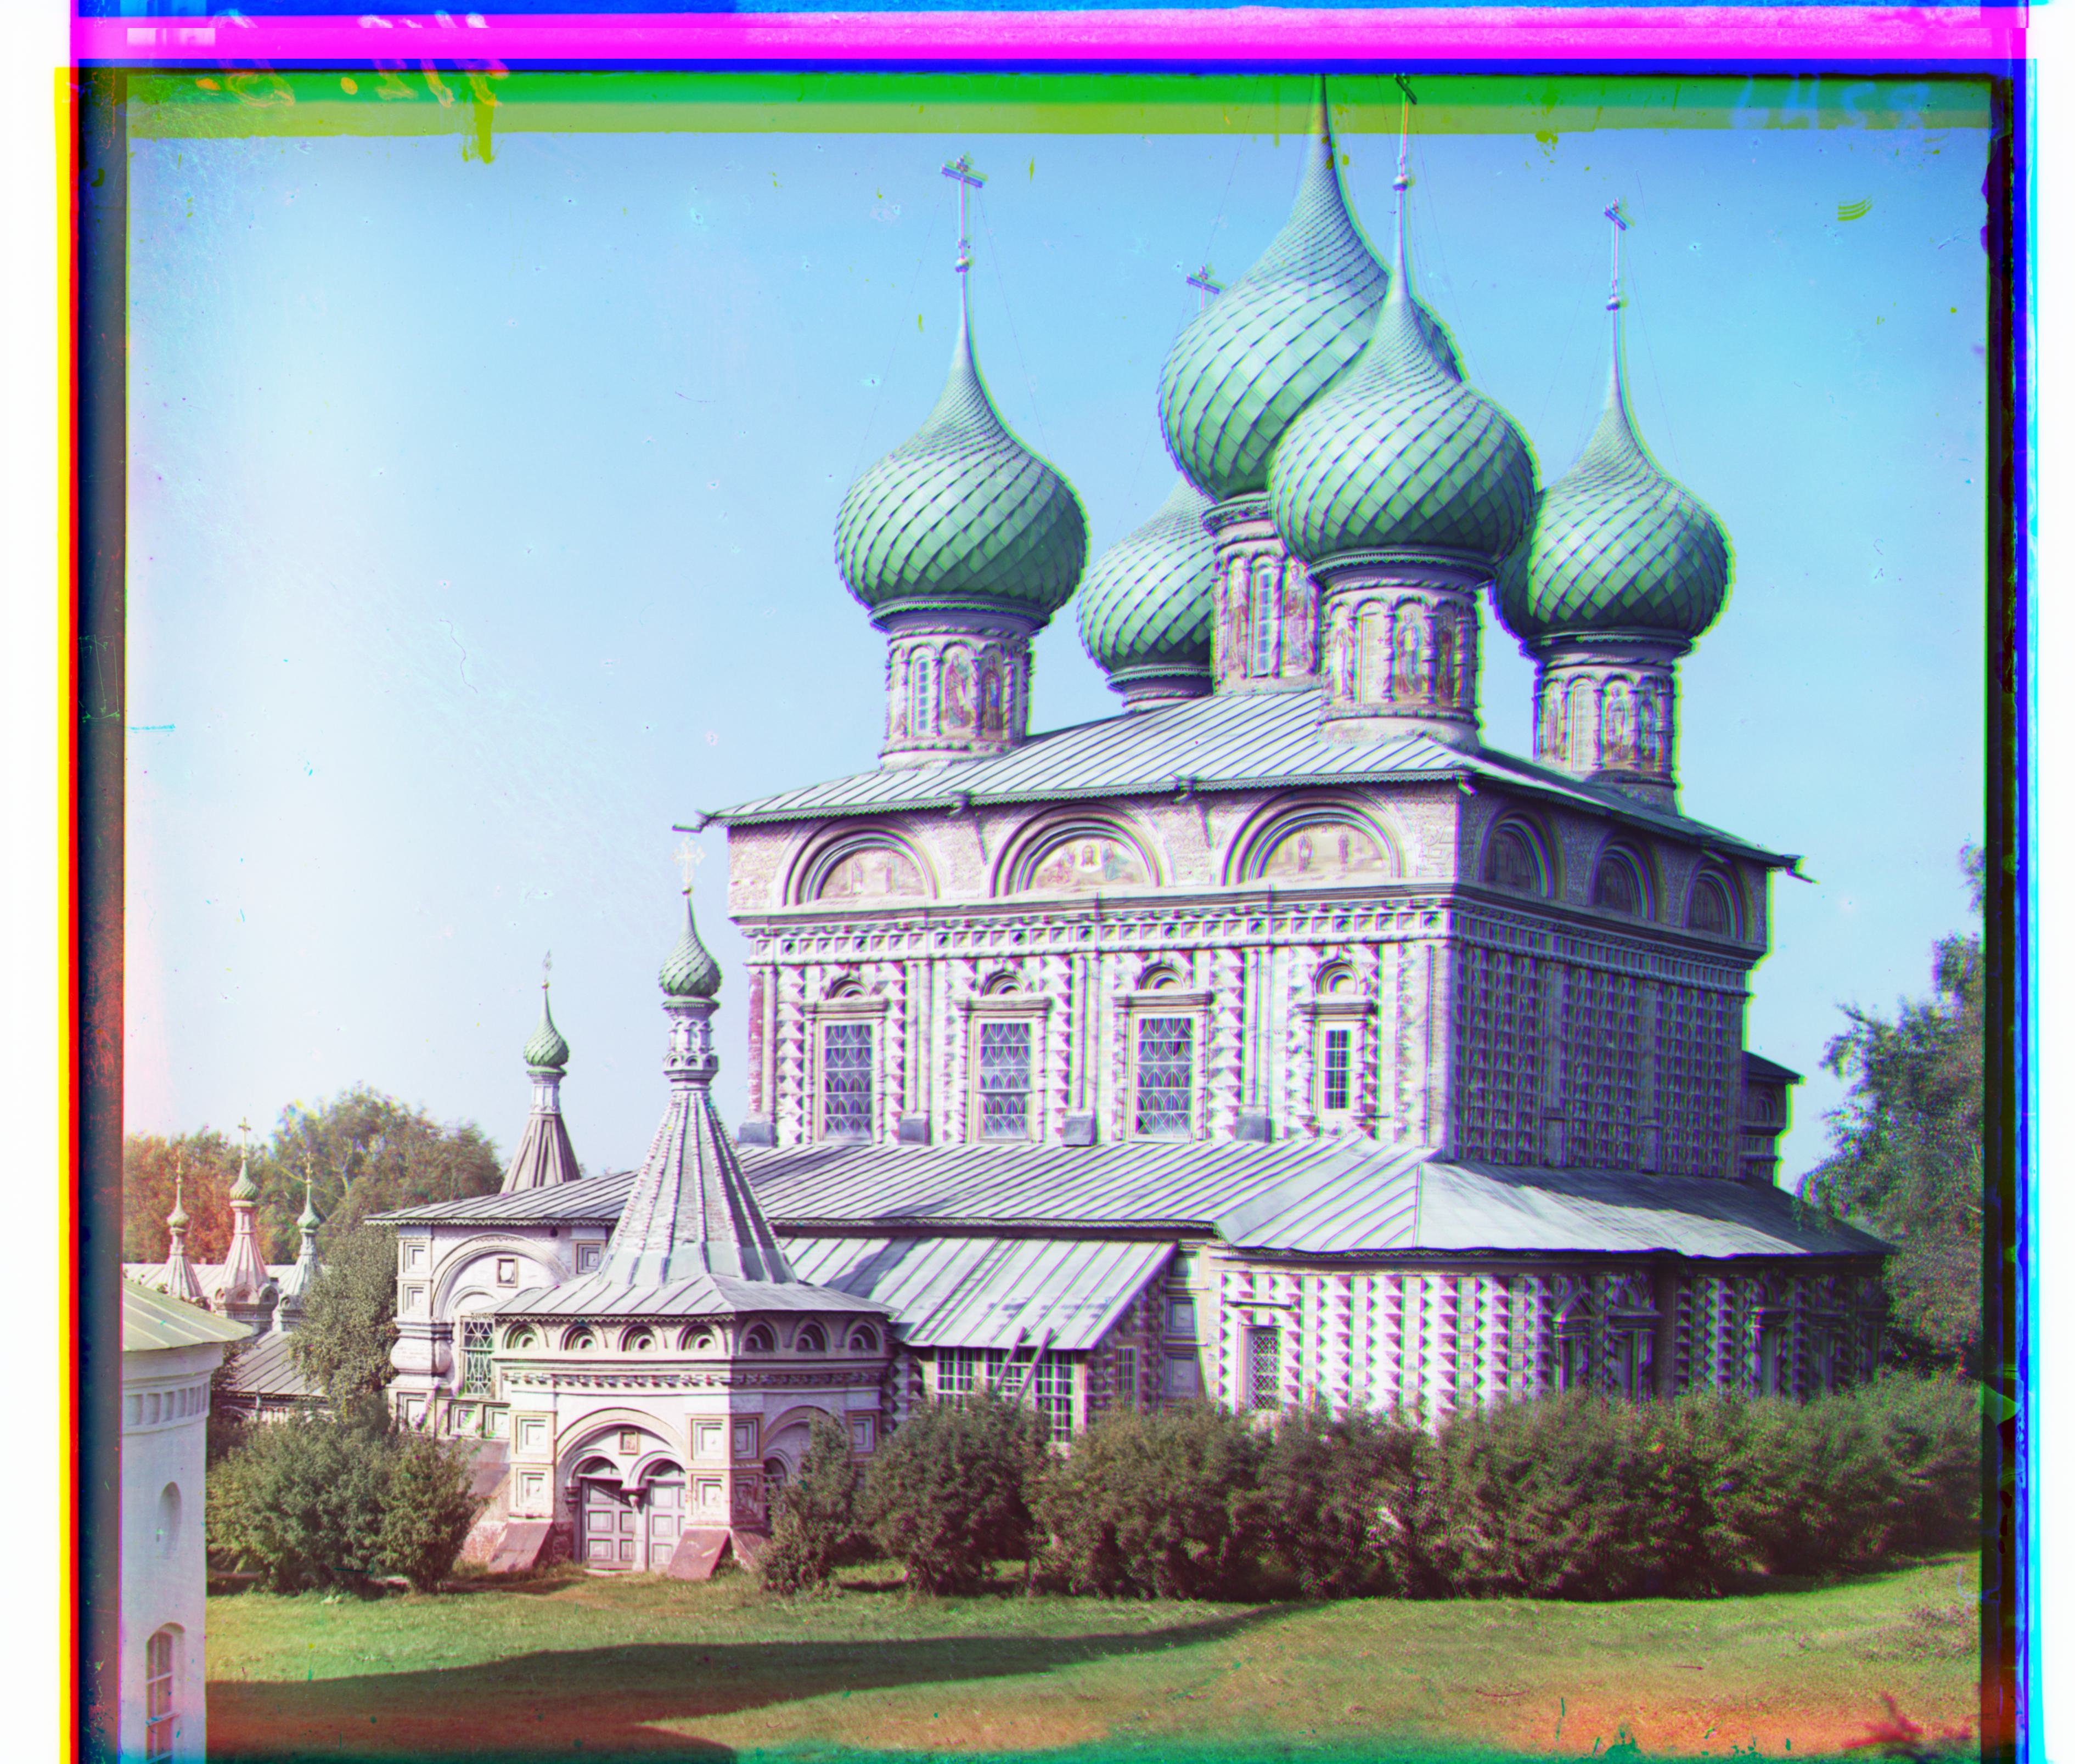
At each level, I divided the height/width of the query image by a power of 2. Each iteration would displace the query image 1 px up, down, left, and right, then pick the shift which yielded the highest metric.
Getting the metric involved:
- applying the shift with np.roll
- cropping the image to the inner 0.8*W x 0.8*H px, since the border was interfering with the metric function's results
- applying the metric function
At first I tried MSE & NCC as metric functions. These didn't work so I went back online and found NGD, which also didn't really work (but maybe I was just being impatient). Eventually I found the Structural Similarity Index Measure (and its scikit-image documentation), which gave me pretty good results.

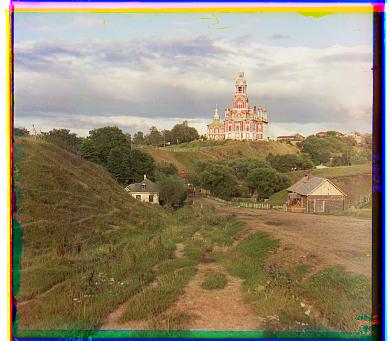
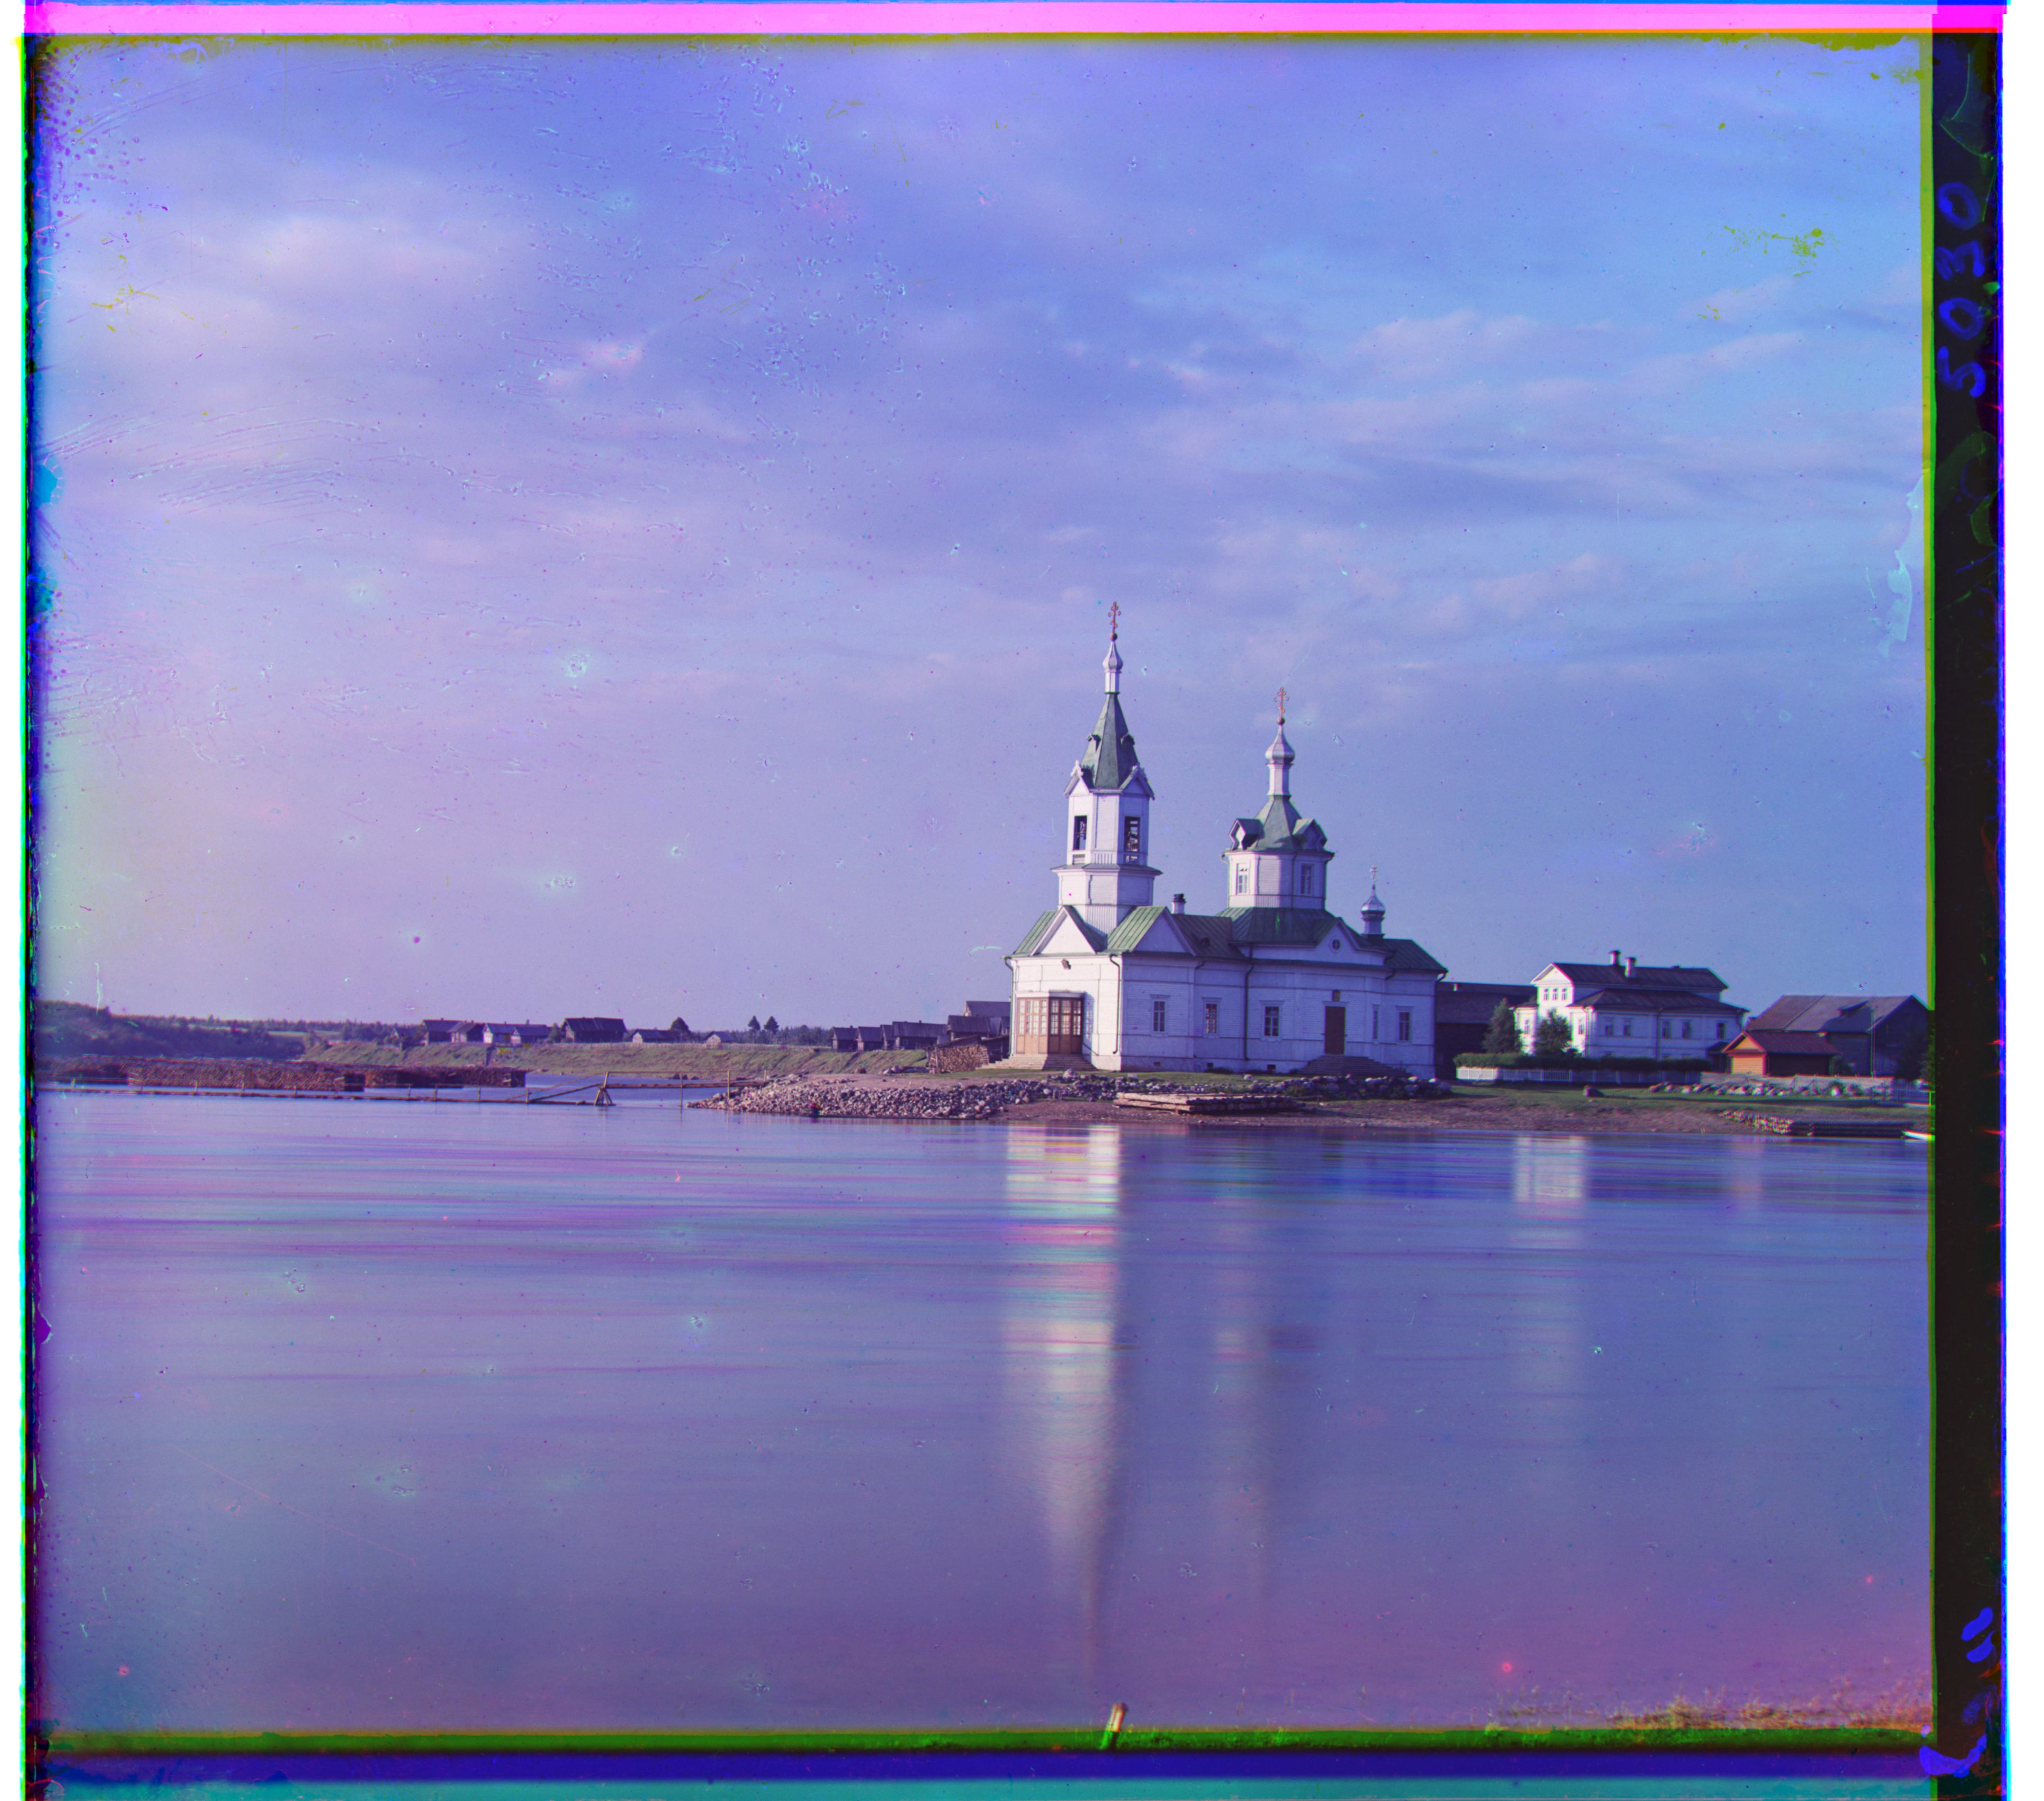
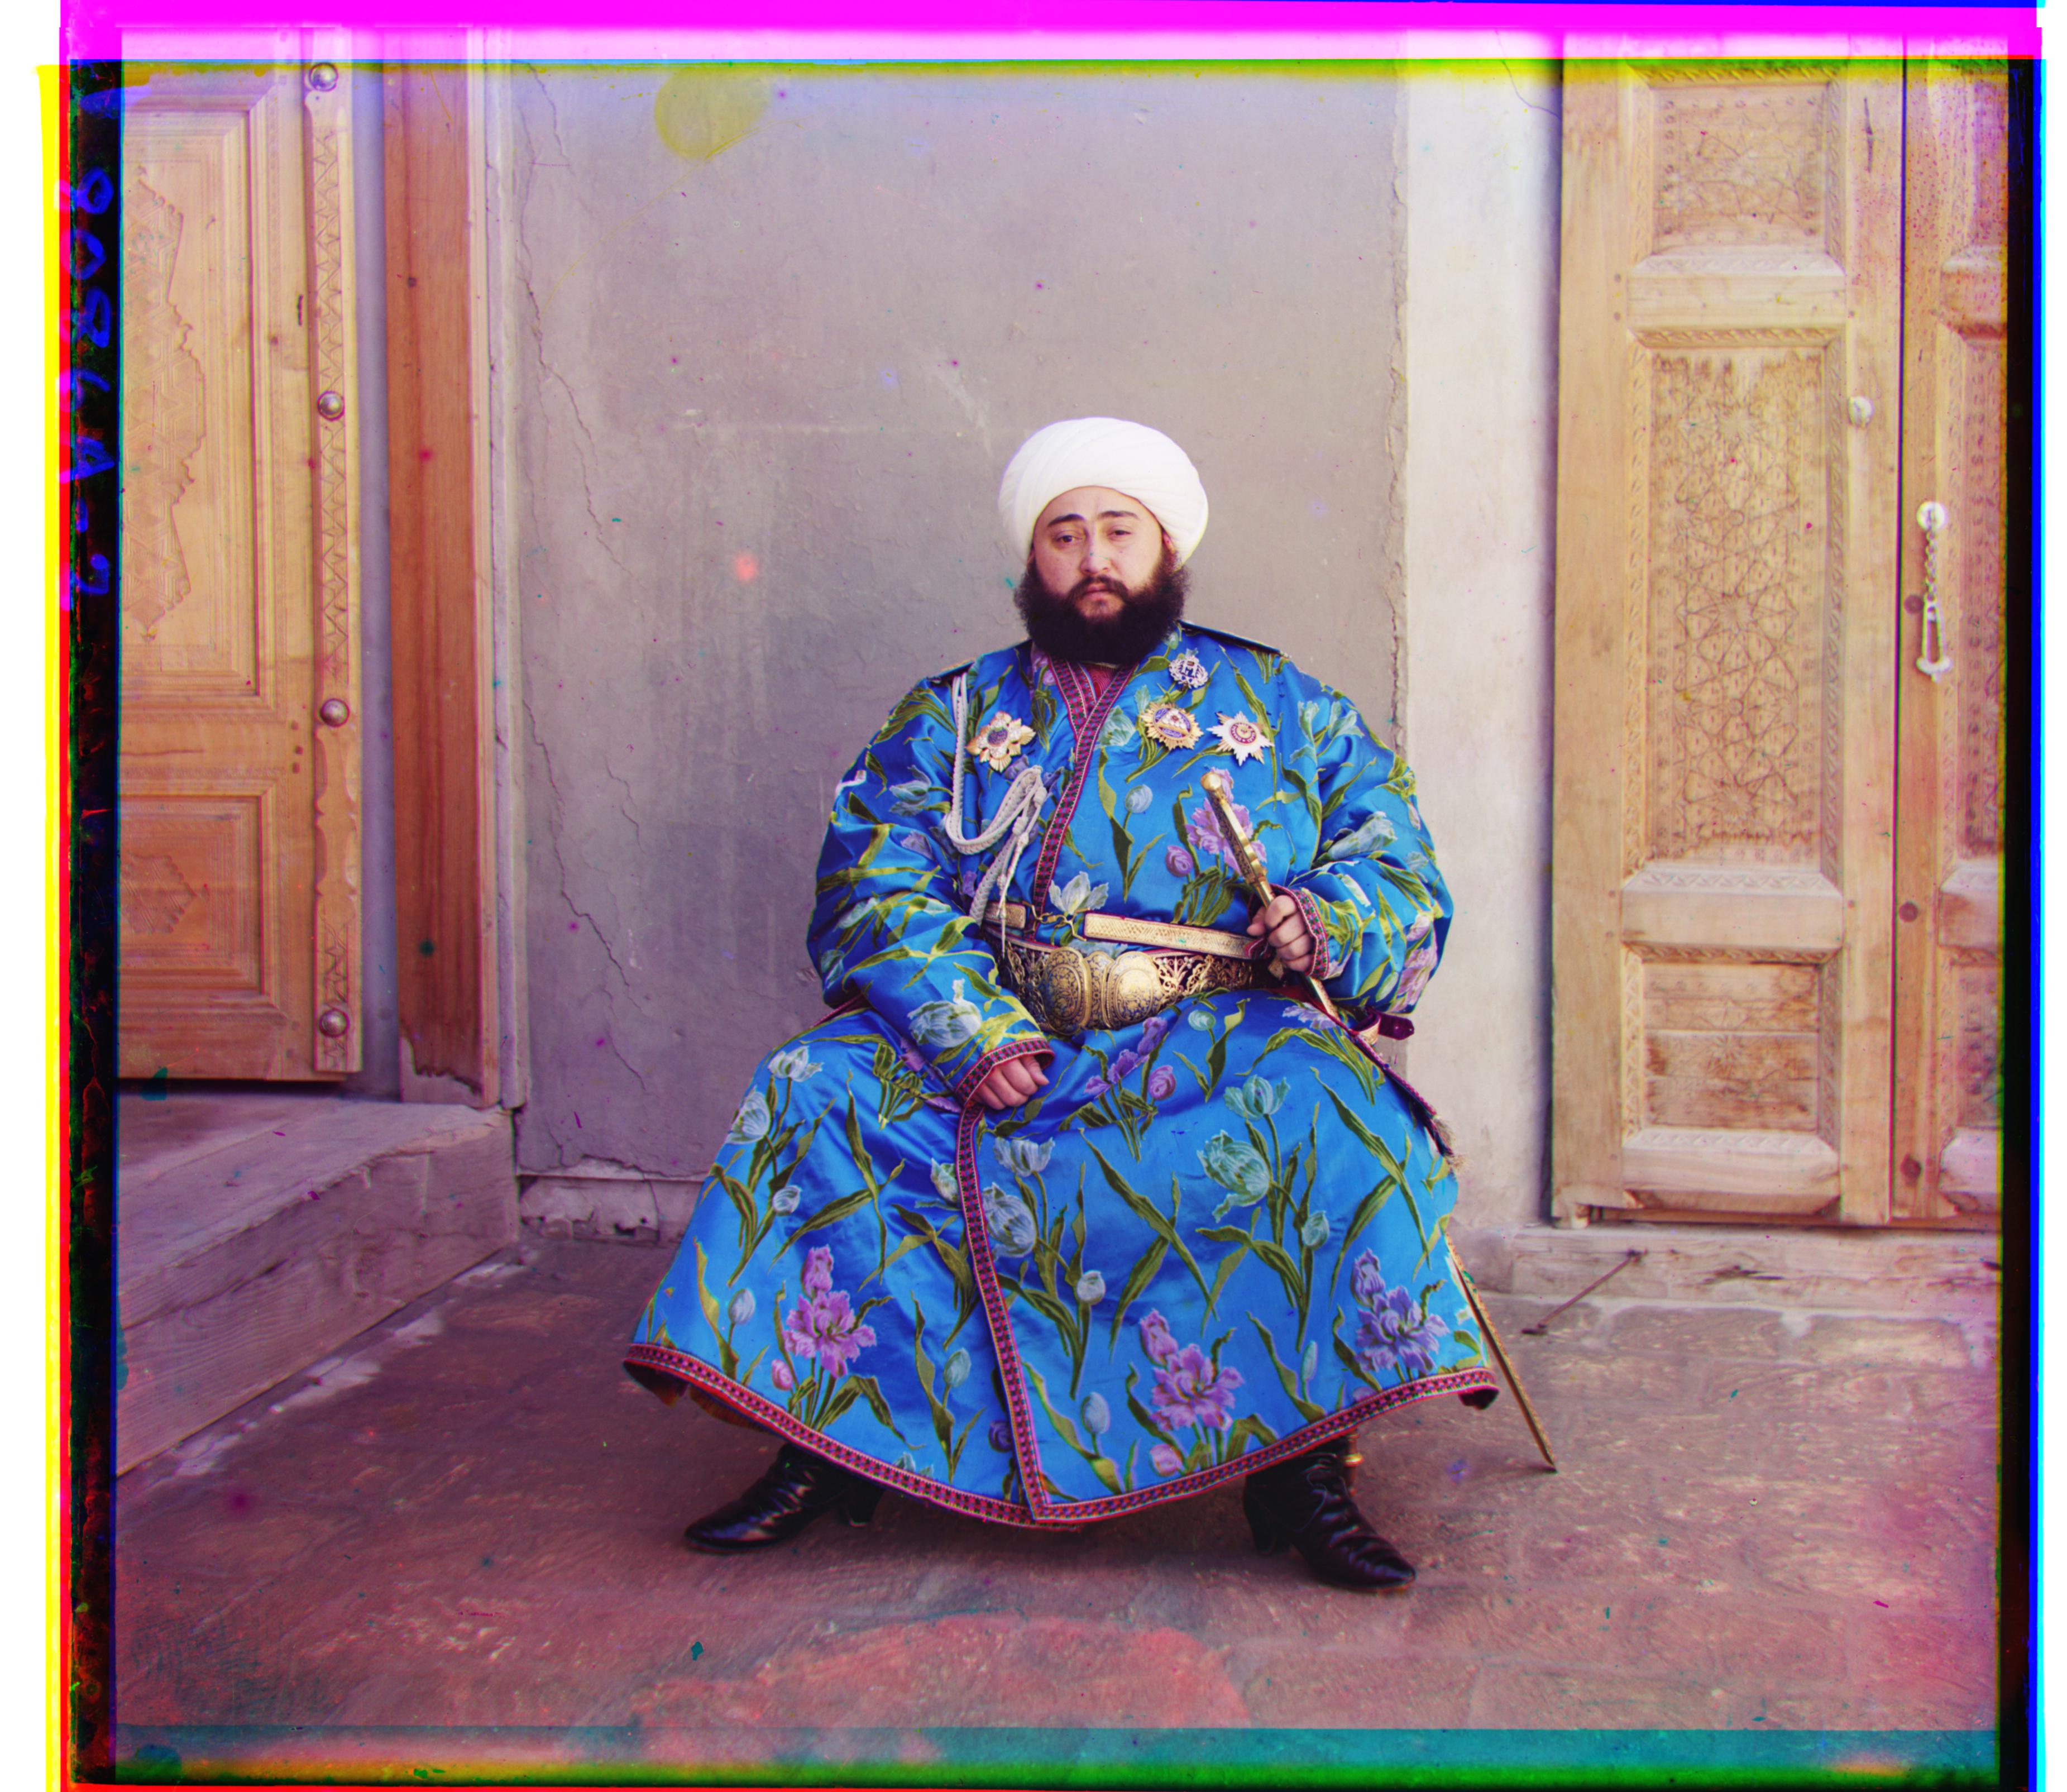
This worked fine (~15sec/TIF). Still lot slower than the phase correlation approach. I'm not super patient so the result images are those I got using phase correlation.


